Grafana
also: Grafana OSS · Grafana Cloud
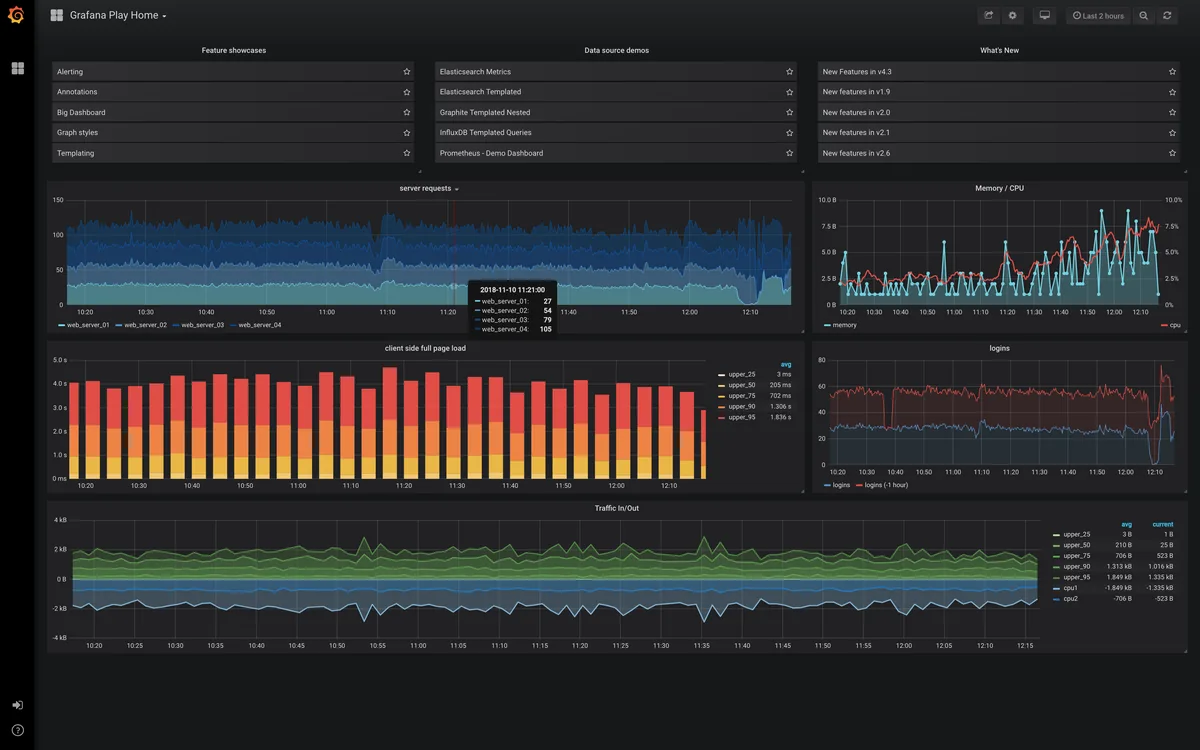
Open-source dashboard and visualization tool for time-series data, used to monitor devices, test rigs, and infrastructure from many data sources.

Grafana queries data sources such as InfluxDB, PostgreSQL/TimescaleDB, and Prometheus and builds dashboards with alerting. The open-source edition is AGPL-licensed, and a managed cloud service is available.
Where it bites: dashboards are only as good as the underlying data model, alert rules need tuning to stay actionable, customer-facing access needs careful permissions, and the AGPL license matters if you modify Grafana and offer it as a service.
Outside help is worth it for test-rig and fleet dashboards, alert design, query, and data-model design, and customer-facing deployments.
Common requests
- Test-rig and fleet dashboards
- Alert rules that are actionable
- Data source and query design
- Customer-facing dashboard access control
Founder takeaway
Start with one dashboard per decision-maker and one alert per action someone will actually take.
official site: grafana.com · Grafana Labs
engineer review pending